Quick answer
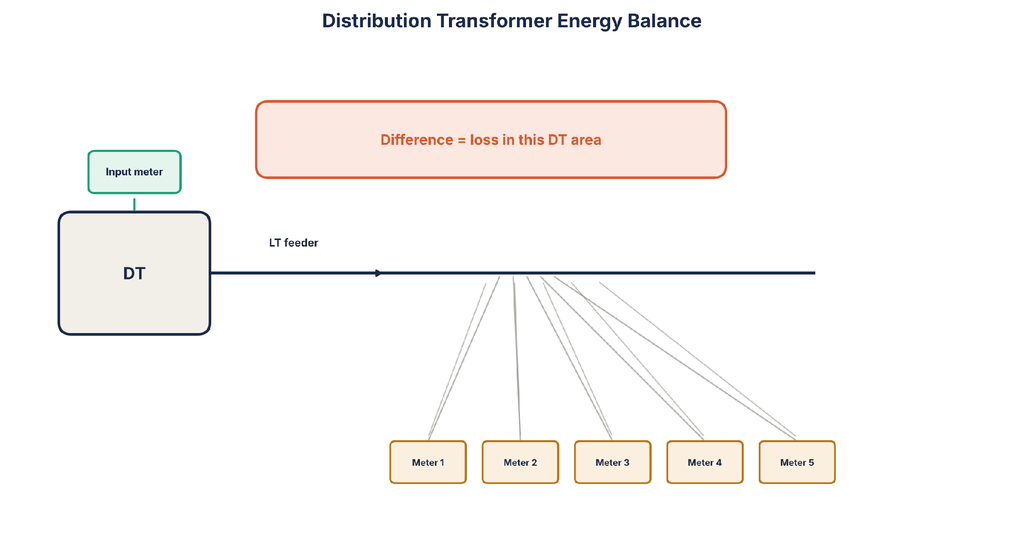
Diagram of a distribution transformer energy
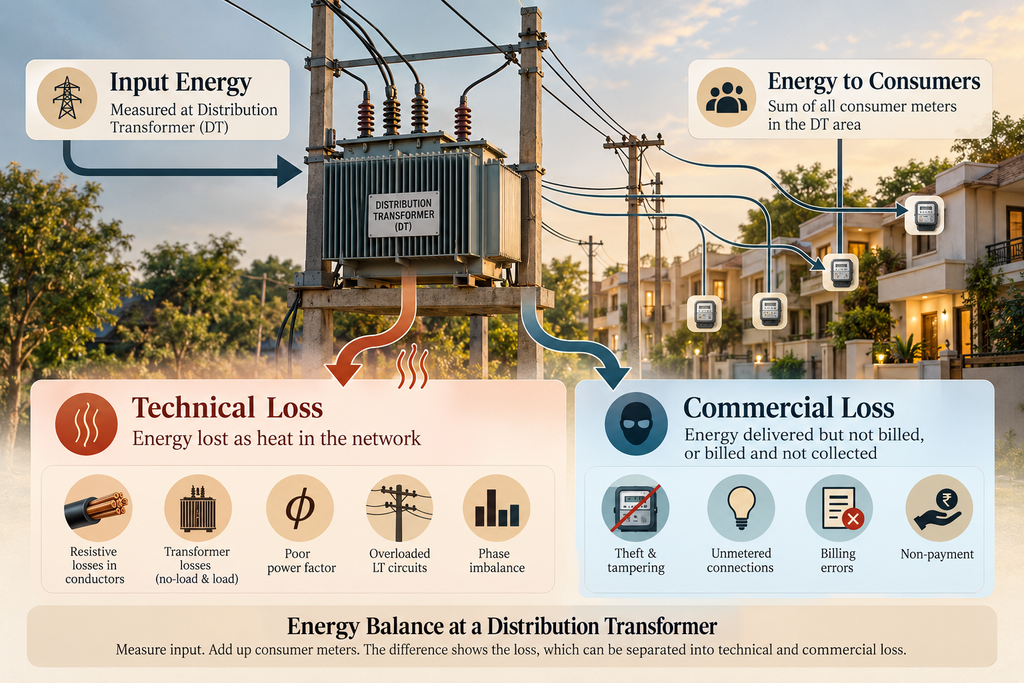
Technical loss is energy lost as heat in conductors and transformers. Commercial loss is energy delivered but never billed, or billed and never paid. Many energy accounts arrive at technical loss as a leftover, so it absorbs every estimating error. An energy balance at each distribution transformer is how you separate the two.
Key takeaways
- India’s AT&C loss has improved. The national figure still says nothing about which kind of loss is left.
- Technical and commercial loss respond to different fixes, different budgets and different timescales.
- A technical loss figure calculated as a remainder describes the estimate as much as the network.
- A distribution transformer (DT) energy balance, read at different load levels, points to which kind of loss dominates in each area.
- Equipment supplies part of the picture. Aligning consumer data to the same period is the harder part.
The split matters more than the total
India’s aggregate technical and commercial (AT&C) loss improved from 21.91% in FY2021 to 15.04% in FY2025, according to the Ministry of Power (press release, 2 February 2026). The Ministry credits the collective effort of states and a range of reforms, including smart metering. That is real progress.
It is also one number. It tells you how large the remaining gap is. It does not tell you what the gap is made of.
That distinction is practical, not academic. The two halves respond to different interventions, on different timescales, from different budgets.
| Technical loss | Commercial loss | |
| What it is | Energy lost as heat in the network | Energy delivered but not billed, or billed and not collected |
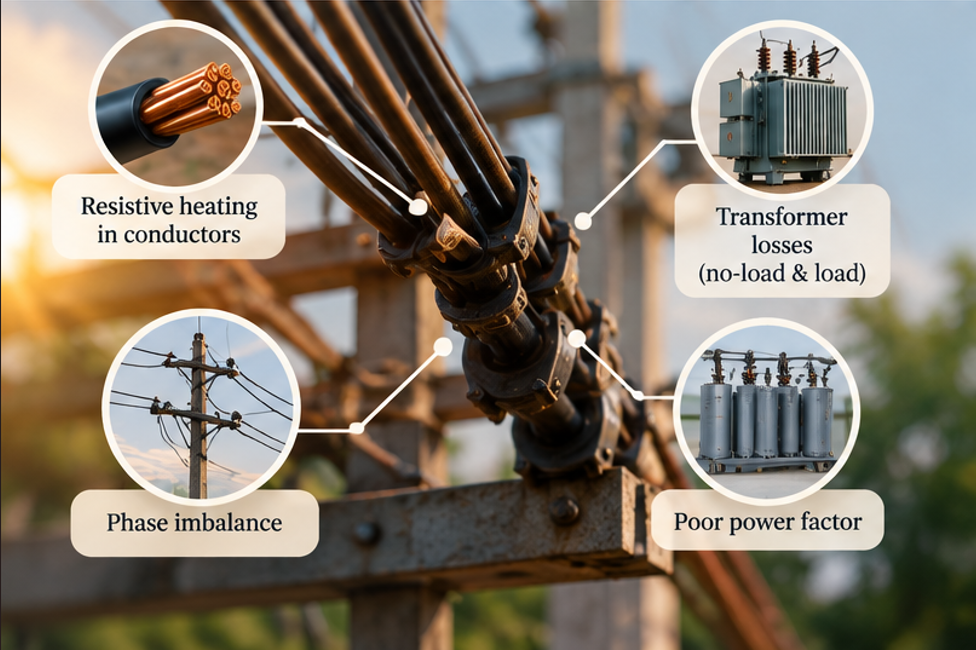
| Typical causes | Resistive heating in conductors and joints, transformer losses, poor power factor, overloaded LT circuits, phase imbalance | Theft, tampering, unmetered connections, billing errors, non-payment |
| Typical fixes | Reconductoring, load balancing, capacitors, right-sizing transformers | Metering, enforcement, billing discipline, collection process |
| Typical timescale | Years | Months |
| Cost profile | Capital-heavy | Process-heavy |
| Can it reach zero? | No. Physics sets a floor | In principle, close to it |
Put capital into the wrong half and the loss figure barely moves. That mistake is expensive, and it usually happens because the split was estimated rather than established from measurement.
How the split is often calculated
Here is the usual method, stated plainly.
Input energy to the network is known reasonably well. Billed energy is known. Collection is known. Subtract billed energy from input and you have total loss. Then estimate the commercial part (theft assessments, known unmetered categories, agricultural assessments) and label whatever is left as technical.
That is a remainder, not a measurement.
A remainder has one awkward property. It absorbs everything that was estimated wrongly elsewhere. If agricultural consumption is assessed generously, technical loss looks smaller. If a reading cycle slips, technical loss moves. If unmetered supply is under-declared, technical loss grows.
So a technical loss figure that barely changes from year to year may reflect stable estimating assumptions as much as a stable network. That is not a criticism of the engineers who prepare the energy account. It is a known limit of the method.
A two-question test for your own figure
Ask two questions of the technical loss number in your latest energy account.
- Was it calculated from network data, such as a load-flow study or a metered energy balance, or was it left over?
- If the estimated commercial components moved by 20%, would the technical number move by roughly the same amount in the other direction?
If the answer to the second question is yes, the technical figure is describing the estimate rather than the network. That is worth knowing before anyone commits capital against it.
What separating them properly takes
Technical loss can be measured, or at least bounded, through energy accounting at the distribution transformer.
The principle is simple. Measure the energy entering a DT. Add up the energy recorded by every consumer meter fed from it, over exactly the same period. The difference is the loss inside that DT’s LT area.
The groundwork for this now exists at very large scale. Under the Revamped Distribution Sector Scheme (RDSS), smart metering has been sanctioned for 19.79 crore consumers, 52.53 lakh distribution transformers and 2.05 lakh feeders, across 45 distribution utilities in 28 States and Union Territories (Ministry of Power, 2 February 2026). Energy accounting is also a regulatory exercise for distribution companies under the Bureau of Energy Efficiency’s 2021 regulations on energy audit in electricity distribution companies.
The DT-area difference still contains both kinds of loss. But it is now bounded to a small, specific area instead of being spread across a whole utility, and that changes what you can infer from it.
Reading a DT-area balance against load
The most useful thing to do with a DT-area balance is to compare it across periods with different load. Each loss type behaves differently as load changes, and that behaviour is its signature.
- Load loss rises with the square of current. This is the loss in conductors, joints and transformer windings. As a share of the energy delivered, it grows as load grows. A DT area whose loss percentage climbs clearly at peak load is showing a technical signature. Sustained overload also shortens the transformer’s life, which is covered in our guide to distribution transformer failure: causes and warning signs.
- No-load loss stays roughly constant. A transformer’s core loss is drawn whether the load is high or low. As a share of energy, it is largest when load is light. A high loss percentage at light load that falls as load rises can point to a lightly loaded or oversized transformer. That is still technical loss.
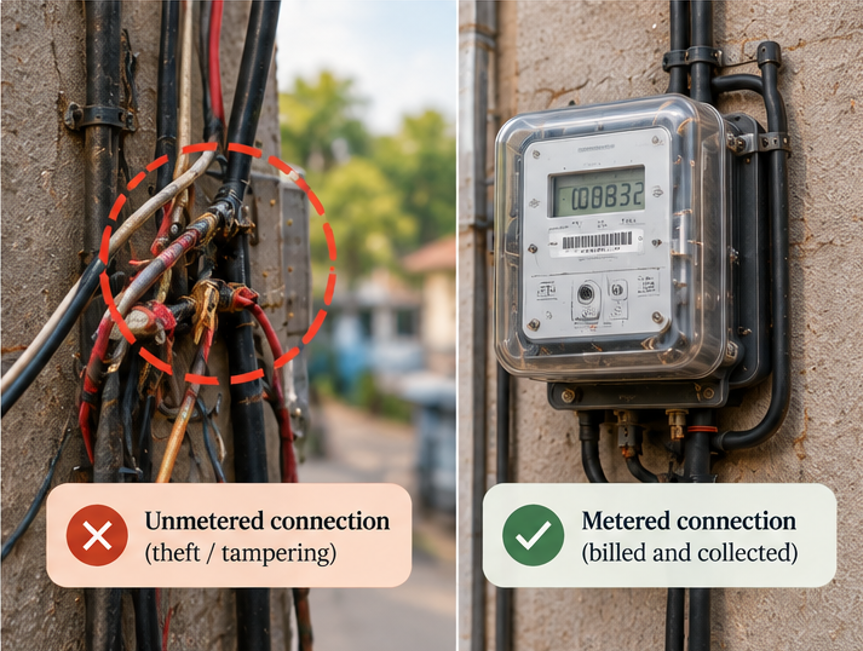
- Commercial loss tends to move with the consumption it replaces. An unmetered hook-up draws more on a hot evening, just as the metered neighbours do. So its share of energy tends to stay roughly flat as load changes. For how this shows up in metering data, see power theft detection: what meters catch and what they miss.
- Consumer-side patterns sharpen the reading. Meters reading zero for months, sudden unexplained drops, or consumption far below connected load in a high-loss area all point towards commercial loss.
None of this needs new theory. It needs a measurement at the transformer, consumer readings aligned to the same period, and two periods with clearly different load.
Why this is hard on Indian LT networks
Three practical obstacles, all of them real.
- Reading synchronisation. A DT balance works only if the DT reading and the consumer readings cover the same interval. Where consumer meters are read on a rolling cycle across a month, the sum of consumer readings does not match any single interval of DT input. The timing error can be larger than the loss you are looking for. Smart meters that record interval data remove much of this problem, which is one reason the RDSS rollout matters to loss analysis and not only to billing.
- Unmetered categories. Where agricultural or street-lighting supply is unmetered, the consumer-side sum is incomplete by design. No amount of measurement at the transformer fixes that. Only metering, or a documented and consistent assessment, does.
- Consumer indexing that has drifted. The Forum of Regulators’ model standards of performance define consumer indexing as identifying each consumer with the pole, distribution transformer, feeder and substation that serve them. LT networks get reconfigured in the field, and the records do not always follow. If three consumers are actually fed from the neighbouring DT, the balance for both areas is wrong and neither number means much. Check indexing on the ground before drawing conclusions from any energy balance.
Declaring our interest: what monitoring can and cannot do
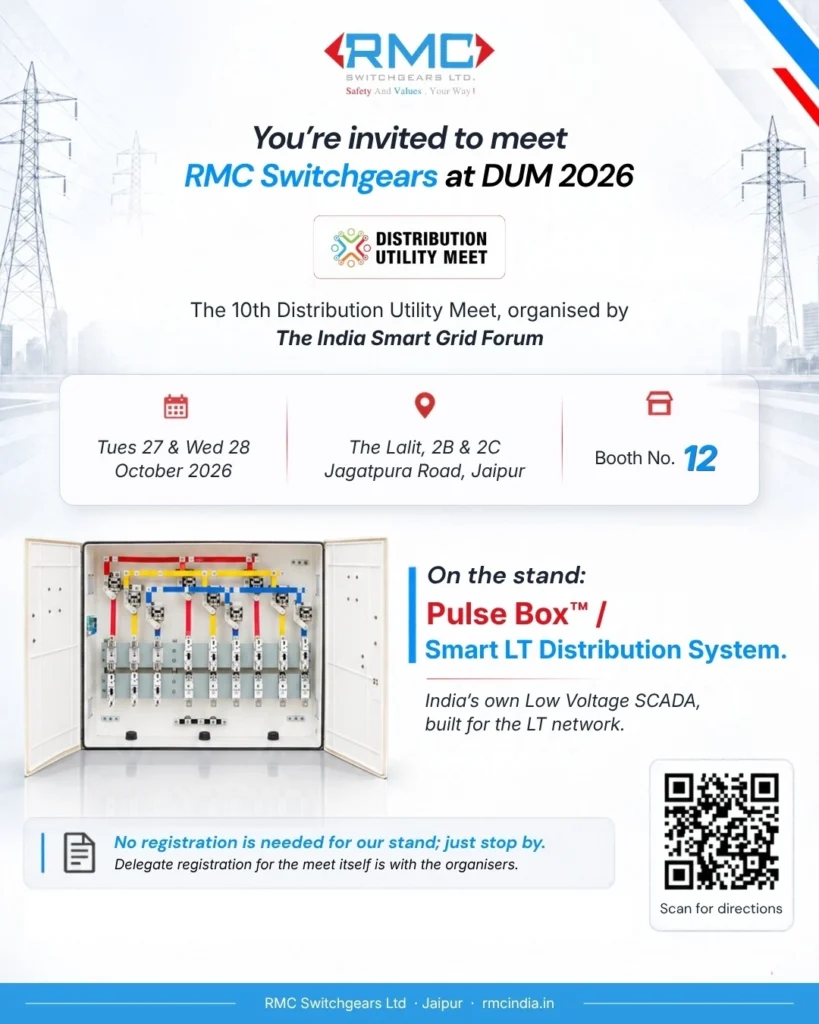
RMC Switchgears Limited makes LT distribution boxes and the Pulse Box™ / Smart LT Distribution System, so it is worth being precise about where equipment helps and where it does not.
A monitoring device does not separate technical from commercial loss. The input side of the balance comes from the DT meter. The other side comes from consumer meters. Aligning the two is a data and process task, not a hardware task. If consumer readings cannot be aligned to a common interval, more instruments at the transformer leave the calculation just as unreliable.
What LT-side monitoring adds is part of the explanation. The DT-area balance tells you that an area is losing energy. Conditions on the LT side, such as phase imbalance, poor power factor and harmonics, help explain why a particular area is losing more than its neighbours.
Pulse Box™ sits at the LT distribution box, between the DT meter and the consumer meters. Pulse Box™ monitors leakage current and flags abnormal conditions. Its product page lists continuous monitoring of harmonics, phase imbalance, power factor, temperature and leakage current. It complements smart meters. It does not replace the DT meter, the consumer meters or the protection on the network.
Where to start
Pick one DT area where consumer metering is reliable and consumer indexing has been checked on the ground. Build the energy balance for one clean month: input at the transformer, and the sum of consumer readings for exactly the same period.
Repeat it for a second month with clearly different load. If the loss percentage rises with load, you are mostly looking at technical loss. If it holds steady, look commercially. If it is high at light load and falls as load rises, check the transformer’s sizing.
One transformer, two months, and you will know more about that area than the annual AT&C figure can tell you.
To assess the same site in a structured way, download the LT-Interface Site Checklist: 13 questions to ask before your team calls a distribution transformer site “assessed.”
Sources
- Ministry of Power, Progress on smart meter installation under RDSS, PIB release ID 2222217, 2 February 2026: AT&C loss figures and RDSS smart-metering sanctions.
- Forum of Regulators, Model Distribution Standards of Performance Regulations, November 2009, definition of consumer indexing.
- Pulse Box™ product page, monitored parameters.
About RMC Switchgears
RMC Switchgears Limited, based in Jaipur, develops electrical distribution, enclosure and safety solutions for utilities, EPC contractors and infrastructure customers across India. Its portfolio spans metallic and composite enclosures, FRP safety solutions, LT distribution equipment and intelligent LT-network solutions, including Pulse Box™.
Frequently asked questions
What is the difference between technical and commercial loss?
Technical loss is energy lost as heat in conductors, joints and transformers while electricity moves through the network. Commercial loss is energy that reaches a consumer but is never billed, or is billed and never collected. Technical loss is set by physics and reduced through capital work. Commercial loss is set by process and reduced through metering, billing discipline and enforcement.
How is technical loss usually calculated?
Many energy accounts calculate it as a remainder: total loss minus the estimated commercial loss. That is arithmetically sound but weak as a diagnosis, because the remainder absorbs every estimating error elsewhere in the account. A more direct figure comes from a load-flow study or from energy accounting at distribution transformer level, where input and consumer readings cover the same period.
Can technical loss be reduced to zero?
No. Moving current through a conductor always loses some energy as heat, and every transformer draws some no-load loss. Technical loss can be reduced a great deal through reconductoring, better load balancing, power factor correction and transformers sized to their actual load, but physics always leaves a floor.
How do you tell technical from commercial loss in one DT area?
Compare the area’s energy balance across two periods with different load. Loss that rises sharply at peak load is mostly technical, because load loss grows with the square of current. Loss that is high at light load and falls as load rises suggests transformer no-load loss. Loss that stays flat as a share of energy, with unusual consumer meter patterns, points to commercial loss.
Why does DT-level energy accounting fail on some networks?
Three common reasons. Consumer meters read on a rolling cycle cannot be matched to the same interval as the DT reading. Unmetered categories leave the consumer-side sum incomplete. And field reconfiguration of the LT network is not always reflected in consumer indexing, so consumers are counted against the wrong transformer.
Does smart metering separate technical and commercial loss automatically?
Not on its own. Smart meters at the consumer and DT ends supply both sides of the balance, often for matching intervals, which removes the synchronisation problem. Someone still has to run the balance for each DT area, check consumer indexing on the ground, and read how the loss behaves as load changes. The meters make the analysis possible. They do not do it.